Boost IT Team Performance: Key Software & Metrics for CTOs and CEOs
Kristijan Pušić | February 15th, 2024
Imagine it’s Monday morning, and as a CTO, you’re starting your week reviewing the progress of your development teams. You notice that despite the overtime and extra effort, your team’s delivery pace is not meeting market demands. Features that should take weeks to deploy are dragging into months. Moreover, each release seems to introduce as many bugs as improvements, leading to frustrated clients and a demoralized team. You’re not alone in this struggle. Many tech leaders face these challenges, watching as their teams grapple with inefficiencies that seem to stem from invisible roots. The question then becomes, how can you turn the tide? How do you pinpoint the bottlenecks in your development process and empower your team to deliver faster, higher quality results without burning out?
In this article, I will use some of these specialized software packages such as Jellyfish, LinearB and Pluralsight Flow as examples. They have a lot in common and are very valuable to any team using them. But they are also a bit different, so each company needs to find its own best fit. Performance management explains team dynamics as a whole, but let’s take a closer look at what it really means, what you’re really measuring and how it can help you as a business. Some of the software on the market also shows statistics related to the company as a whole and tries to shed some light on this segment as well.
DORA Metrics
Frequency of deployments, the amount of time between acceptance and deployment, how frequently deployments fail, how long it takes to restore service or recover from a failure.
Deployment Frequency measures how often an organization successfully releases to production. Frequent deployments indicate a high-performing IT team that can deliver features, fixes and updates quickly. Lead Time for Changes is the time it takes for a change to go from code commit to production deployment. Change Failure Rate is the percentage of deployments that fail in production. A lower Change Failure Rate indicates better quality control and reliability of deployment processes. Shorter lead times indicate that a team is more efficient and agile. Time to Restore Service measures how long it takes a team to recover from a production outage. A shorter recovery time indicates that a team is more effective at diagnosing and fixing problems quickly, minimizing downtime. For example, using these metrics, an organization may discover that while they have a high deployment frequency, they also have a high change failure rate, indicating a need to focus on improving testing and quality assurance processes.
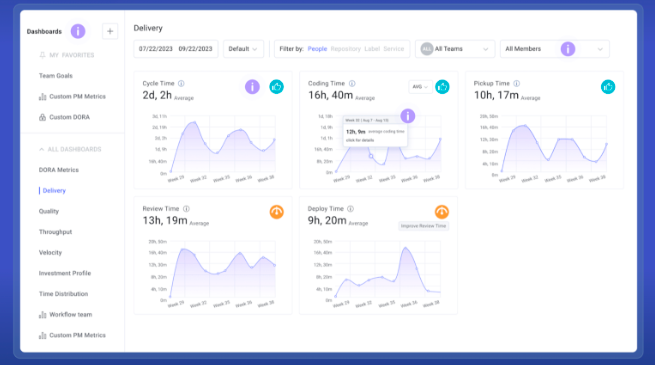
Dora Metrics is an integral part of all the solutions on the market, so as a user you can see cycle time, pickup time, review time and deployment time. It is easy to identify weaknesses in your ci/cd flow or slow response times from team leads in certain situations. Adding automatic code acceptance criteria after a certain percentage of code coverage has been achieved is a necessary step in getting the best out of your team. Linking notifications within your SLACK is also a good idea to speed up response times in certain situations. Every team in a company can agree on 2 or 3 points where notifications are welcome. Adding some of these metrics to your company’s OKRs is also a good practice.
DevOps Research and Assessment, aka DORA metrics, shows you the problems you have as an organisation in your perhaps not yet completed Devops transformation. The Devops transformation should have followed the Agile transformation you have done as an organisation before. Developers in the company have gone through few workshops on devops topics, and these skills are part of the company matrix and part of the developer skill set.
It is not all DORA: Code Coverage and Code Churn work closely together to help us on our journey to better team performance
Code coverage is the amount of code covered by tests, so if the code sent to a team lead for acceptance has, let’s say, 80% of the code covered by tests, it should be automatically accepted. It may be interesting for some team leads to be notified of this, in the sense of the notifications in their SLACK workspace mentioned above. Writing all kinds of tests is an essential part of skill matrices, all your code should be covered by appropriate tests.
Code churn or rework metrics will be more indicative of developer seniority and the overall quality of the code previously written. Old code is code older than X. Lower numbers indicate less refactoring as a result of that seniority, while more frequent occurrences of higher code churn indicate more junior developer skills. Even code that is only a few days old is often refactored? It is easier to explain a developer’s overall skill level when they see it compared to data from a more senior colleague. Much easier to give bad feedback or answer the question “why am I not senior yet? Don’t forget to use retrospectives with your team to reflect on your team goals for code coverage and code churn.
Visual Charts and Perfect UX Make it Easy To See and Compare Your Developer Skills and Team Performance
You can see visual comparisons from daily (maybe less interesting) to any time range (more than 1 year). Very valuable data is already stored in your company’s Jira and Gitlab accounts.
The first good practice is to import historical event data from Jira and Gitlab, so be careful to ask your software vendor to connect that history. Why do this? First of all, you need some data to compare with, this period against this period. These 2 sprints against these 2 sprints in this and that time period. This team against that team, this developer against that developer. Past data is important. Your own team will also remember some interesting sprints or refactorings and know the real context of the situation. This will explain to them what really happened in terms of team metrics. Second, you may have missed some of your agile transformation, so this past data will point you to tasks/sprint/jira/ or daily/retrospective/planning issues that may still exist within your team. Adding your history from Jira and Gitlab is a must.
Second, invite your whole team in to see their team performance, metrics and comparisons. Agile and DevOps transformations are often completely misunderstood, and these kinds of solutions are made for you to complete them. More importantly, if you use them over time, you will be able to avoid making the same mistakes again. People come and go within an IT company, but the culture of high quality coding remains intact. In the long run, you can see why it is so valuable.
Choosing Between Jellyfish, LinearB and Pluralsight Flow
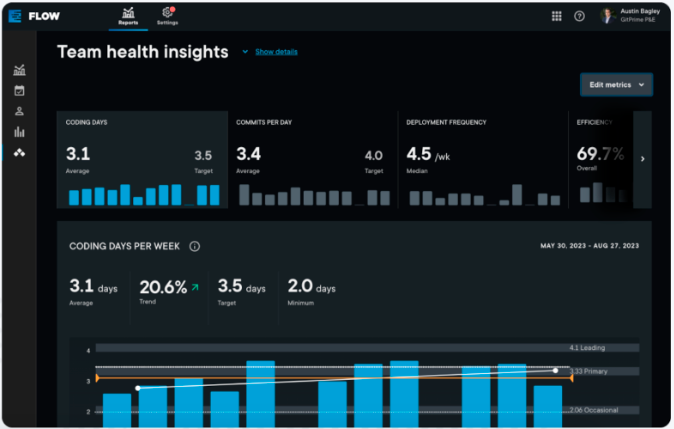
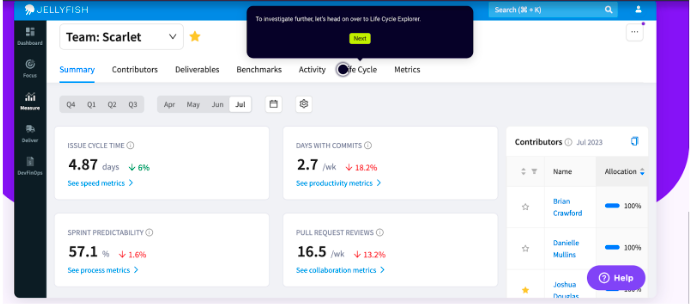
Each solution offers a slightly different approach depending on your needs. In my opinion, Pluralsight Flow is more agile in its structure of links and statistics. Best for younger teams and companies. Yellyfish is more geared towards more mature teams with a lot of different statistics covered, while LinearB is somewhere in the middle of the two. Integration process takes a couple of weeks. It takes time to integrate with Jira and GItlab and the software of your choice. Adding your histories from both is a separate process and adds to this. A pro tip would be to ensure data integrity during the import process. The onboarding customer support for all 3 software packages are highly trained and know how to read your team statistics. They are like senior engineering managers in this area, so listen carefully to what they have to say. Very valuable learning experience!
Team Inclusion and Engagement
The idea is to give more value to tracking their performance. More statistics to explain certain situations. The idea is to build a more transparent and inclusive culture. The idea is to empower IT leaders to make more data-driven decisions to improve teams and processes, ultimately improving both the speed and quality of software development projects. The idea is not to turn to metrics-driven management. Let’s not confuse the issues. The idea is that the ultimate goal is to improve team collaboration, productivity and product quality. Sharing your team’s performance data with AI assistants and asking for feedback is also an option, so the export options of your chosen solution will also play a significant role in the further use of any of the solutions.
Related posts
- Elevator Pitch: How to “Sell” Yourself in One Minute
 All of us have faced the existential question “Who am I?” when meeting a new person, or when being interviewed and asked to “Tell me about yourself”.
 - IT and English: Top 5 Reasons Why an IT Professional Should Be Proficient in English
 I’m sure everyone has wondered: Why do I need English?
 - Setronica Celebrates 25 Years of Business
 Over the past twenty-five years, Setronica has transformed from a fledgling startup into a powerhouse in the realm of information technology, fueled by our unwavering passion for innovation, our relentless pursuit of excellence, and our steadfast commitment to keeping our customers smiling.
 - 5 Exceptional Programming Languages for Artificial Intelligence Integration
![Exceptional_Programming_Languages_for_Artificial_Intelligence_Integration[1]](https://setronica.com/wp-content/uploads/2024/02/Exceptional_Programming_Languages_for_Artificial_Intelligence_Integration1-150x150.jpg) Choose Rust for enterprise innovation, TypeScript for web projects, Golang for backend efficiency, Python for AI dominance, and Java for enterprise integration.
Choose Rust for enterprise innovation, TypeScript for web projects, Golang for backend efficiency, Python for AI dominance, and Java for enterprise integration. - IT Company Good SLACK Practices. How to Folster Solid Roots for a Healthy Working Environment
 SLACK is definitely a widely used communication solution in IT companies, yet it has that extra charm and yet it is not intrusive into the day-to-day life of engineering teams.
 - Unveiling the Potential of B2B Marketplaces: Key Features and Benefits for Owners, Buyers, and Sellers
 B2B marketplaces empower owners with revenue, branding; offer buyers efficient sourcing; provide sellers market reach. Platforms ensure cost-effective, scalable, and secure operations, shaping the future of commerce.
Ready to Enrich Your Team?

Kristijan Pušić
IT consultant and Business developer
Our consultant is at your disposal from 9 AM to 5 PM CET working days from Monday to Friday for any additional questions.
Recent Posts
- How to Efficiently Scale Your Startup’s Tech Stack for Maximum Growth
- Shine in Your Interview: 3 Dos and Don’ts to Prove Your Competence with Confidence
- Elevator Pitch: How to “Sell” Yourself in One Minute
- 9 Best Places to Find Free Datasets for Your Next Project
- 9 Key Measures to Protect Digital Assets and Ensure Data Integrity
